
The Financial Report KPI Web Service Setup page allows you to configure how financial report KPI data is displayed and to select the specific financial reports that will be used as the basis for those KPIs. Once the web service is published, the selected KPI data becomes available in the list of published web services on the Web Services page.
This process is useful when you want to make financial reporting data available for analysis in external tools such as Power BI. By publishing the KPI web service, you create a data source that can be connected to and used for reporting, dashboards, and visual analysis.
Important Note
When using this web service, closing dates are not included in the dataset. However, you can still analyze different time periods by applying filters in Power BI.
How to Set Up the KPI Web Service
To create and publish a KPI web service based on financial reports, follow these steps:
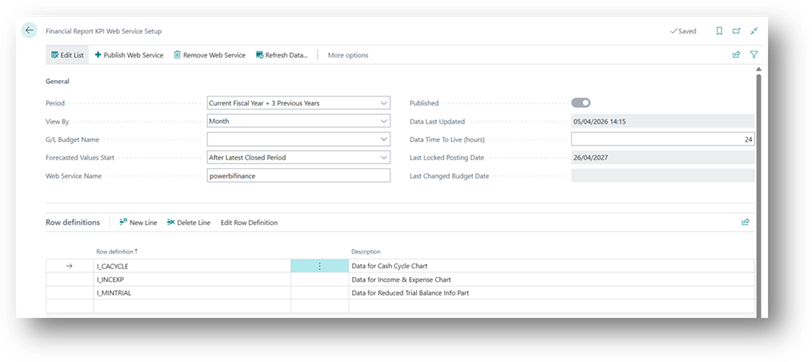
- Select Search in the upper-right corner, enter Financial Report KPI Web Service Setup, and open the related page.
- On the General FastTab, complete the required fields.
- On the Row Definitions FastTab, enter the required information.
- Repeat the setup for each financial report you want to include in the web service.
- If you want to review or modify a selected financial report, use the Edit Row Definition action.
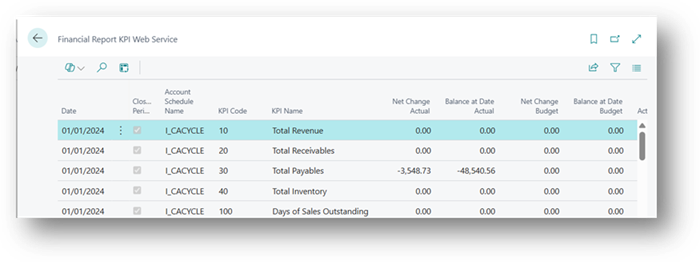
- To see the KPI data you have configured, select the Financial Report KPI Web Service action.
- When everything is ready, choose Publish Web Service to make the data available.
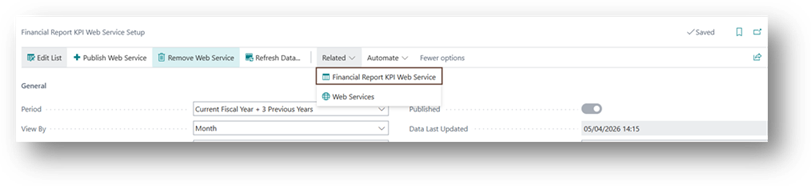
To check the data what is published then click on More option > Related > Financial Report KPI Web Service.
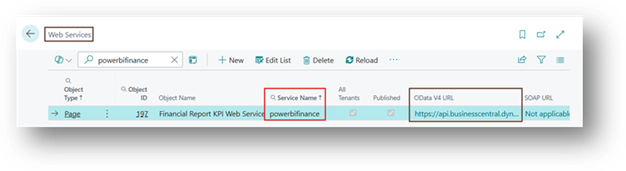
After publishing, the KPI web service appears on the Web Services page and can be used as a data source for Power BI. For example, we name the KPI web service “powerbifinance,” you need to publish it and then search this on the Web Services page.
General FastTab
List of fields that are available in General fast tab section.
- Period: The Period field shows which period the financial report KPI web service is based on.
- View By: The View By field defines the time interval used to display the KPI, such as month, quarter, or year.
- G/L Budget Name: The G/L Budget Name field specifies the general ledger budget that provides budgeted values for the KPI web service.
- Forecasted Values Start: The Forecasted Values Start field tells the system when forecasted values should begin appearing in the KPI chart. These forecasted values come from the selected general ledger budget.
- Web Service Name: The Web Service Name field is the name of the financial report KPI web service. This name appears below the displayed KPI.
- Published: The Published field shows whether the KPI web service has been published. Published web services are listed in the Web Services window.
- Data Last Updated: The Data Last Updated field shows the last time the web service refreshed the data.
- Data Time To Live (hours): The Data Time To Live (hours) field tells how long the data is stored in Business Central before it is refreshed again from the service. A longer time period can reduce the performance impact.
- Last Locked Posting Date: The Last Locked Posting Date field shows the last date when posting was locked and actual transaction values were not included.
- Last Changed Budget Date: The Last Changed Budget Date field shows the last time the general ledger budget for this KPI was changed.
Row Definition FastTab
List of fields that are available in Row Definition fast tab section.
- Code: Code of Row Definition
- Description: Description of Row Definition
Connecting the Web Service to Power BI
Once the KPI web service is published, you can connect it to Power BI for reporting and analysis. The published web service acts as a source of financial data that Power BI can read and visualize.
Basic Connection Steps in Power BI
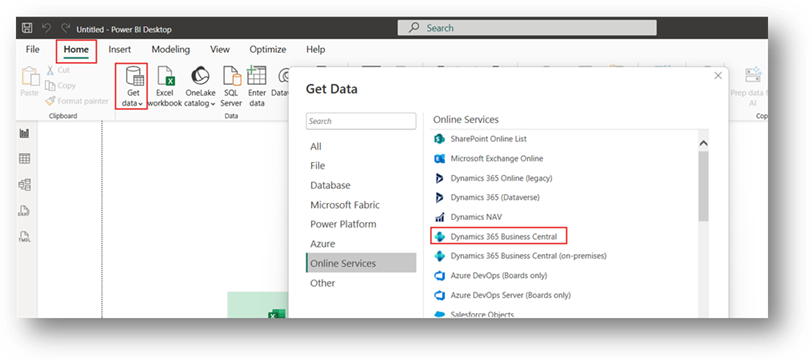
- Open Power BI Desktop.
- Select Get Data.
- Choose the appropriate web service connector, such as OData Feed or another supported connector depending on your setup.
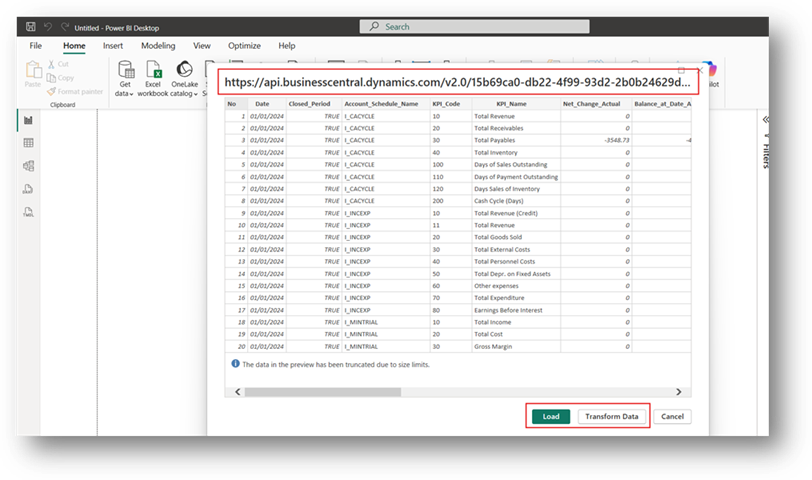
- Enter the URL of the published KPI web service.
- Sign in if required.
- Load the data into Power BI.
- Build visuals, charts, and dashboards based on the financial KPI data.
Benefits of Using Power BI with KPI Web Services
- You can analyze financial KPIs visually.
- You can create interactive dashboards.
- You can filter data by different time periods.
Conclusion
Publishing a KPI web service based on financial reports makes financial data available for broader analysis and reporting. By connecting this web service to Power BI, you can turn financial KPI data into clear, interactive reports and dashboards. This helps businesses track performance and make better decisions using real-time financial insights.